Basically, cross-validation is a statistical method for evaluating learning algorithms. A fixed number of folds (groups of data) is set to run the analysis. These folds group the data into 2 sets: training and testing (validation) sets, that are cross-over in rounds, allowing each data point to be validated.
The main purpose is to test the model's ability to predict independent data that was not used in creating it. It is also useful to cope with problems like overfitting or selection bias.
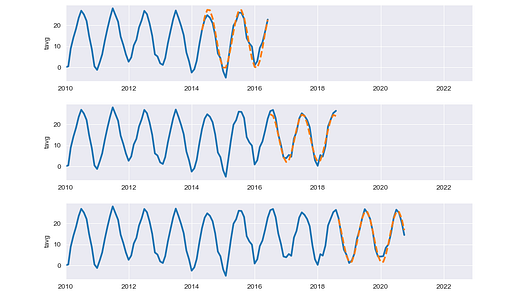
An example of results from cross-validations in this article. Image by Author.
In this article, we are going to apply Python to visualize the process of 3 cross-validation types from the Scikit Learn library:
- K-Fold cross-validation
- Shuffle & Split cross-validation
- Time Series Split cross-validation
Moreover, the validation results can also be plotted to express insightful information.