DNA6 — Flow Metrics to supercharge your Agile teams and a Visual Facilitation Experiment

<p>Jose referred to the work of&nbsp;</p> <p><a href="https://medium.com/u/9b4b3d745832?source=post_page-----d45af270fad1--------------------------------" rel="noopener" target="_blank">Daniel Vacanti</a></p> <p>&nbsp;and&nbsp;</p> <p><a href="https://medium.com/u/343b39257564?source=post_page-----d45af270fad1--------------------------------" rel="noopener" target="_blank">troy.magennis</a></p> <p>, and there is further reading and learning from those guys, as well as the&nbsp;<a href="https://www.scrum.org/resources/kanban-guide-scrum-teams" rel="noopener ugc nofollow" target="_blank">Kanban Guide for Scrum Teams</a>&nbsp;of course. On the night, we had some great conversations about how we could use these metrics.</p> <p><img alt="" src="https://miro.medium.com/v2/resize:fit:1000/1*6m9FlBfnA2Nmu7br3x_52Q.jpeg" style="height:374px; width:1000px" /></p> <p>
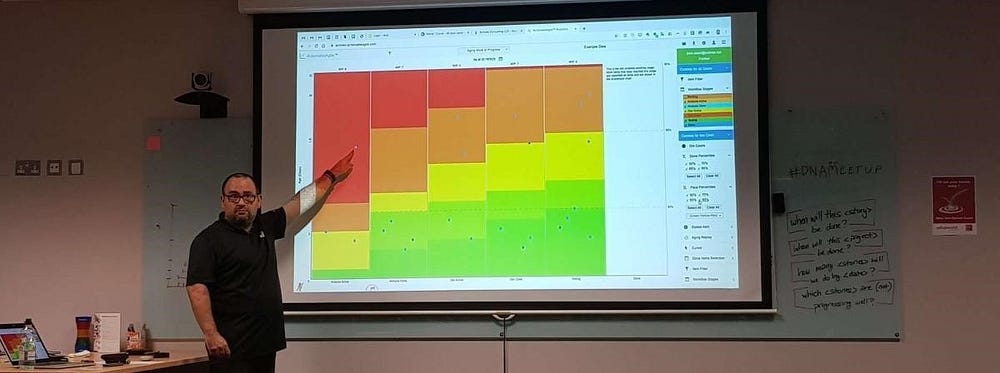
Jose showing the aging metric and how it could be used to guide a Daily Scrum conversation</p> <p>On the night, we also tried an experiment in prioritising visual facilitation techniques. Facilitated expertly by&nbsp;</p> <p><a href="https://medium.com/u/c9ceeae07ac6?source=post_page-----d45af270fad1--------------------------------" rel="noopener" target="_blank">Paweł Olchowik</a></p> <p>, we looked at a range of visual facilitation techniques and rated them by difficulty and impact. This allowed us to plot the ones that we might be able to implement easiest with the highest impact. Further reading available here from&nbsp;Jimmy Janlen&rsquo;s Visualisation Toolbox for the Agile Coach.</p> <p><a href="https://medium.com/dublin-north-agile/dna6-flow-metrics-to-supercharge-your-agile-teams-and-a-visual-facilitation-experiment-d45af270fad1"><strong>Website</strong></a></p> <p>&nbsp;</p>