Imagine you’re a Data Scientist, Analyst, Machine Learning Engineer, or a Web Developer, and you want to transform your Python data script into a quick actionable insight. Streamlit is your answer.
Streamlit is an open-source Python framework that allows you to effortlessly create web applications. With Streamlit, you can turn your data scripts into shareable web apps in minutes, not weeks, and it’s absolutely free to use.
In this article, you will learn how to build an analytics dashboard using the Streamlit Python package. We will guide you through the process step by step, from installing the necessary packages to creating interactive visualizations.
Python Packages
Before we get started, you’ll need to install the following packages using pip:
pip install streamlit numpy pandas streamlit_extras millify altair plotly
After installing the required packages, import them into your python script.
import streamlit as st # streamlit package
import numpy as np
import pandas as pd
from millify import millify # shortens values (10_000 ---> 10k)
from streamlit_extras.metric_cards import style_metric_cards # beautify metric card with css
import plotly.graph_objects as go
import altair as alt
Load the dataset
For this tutorial, we’ll use the Superstore Sales dataset available on Superstore Sales 2023 — dataset by ehughes | data.world.
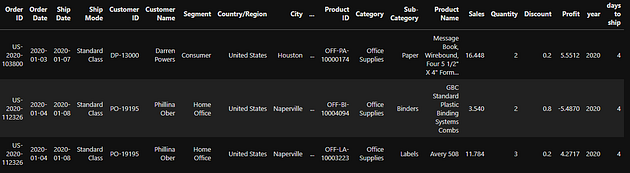
preview of the Superstore Sales dataset.
Before building a dashboard with your data, it’s essential to define the Key Performance Indicators (KPIs) you want to visualize on the dashboard.