Motivation
If you want your manager or colleague to understand your ideas for a project, don’t show them only words or a chunk of code. Use graphs or diagrams.
Imagine you want to explain with your manager the process of training a cat classifier, it would be easier for them to understand the flow of this process by showing them a picture like below.
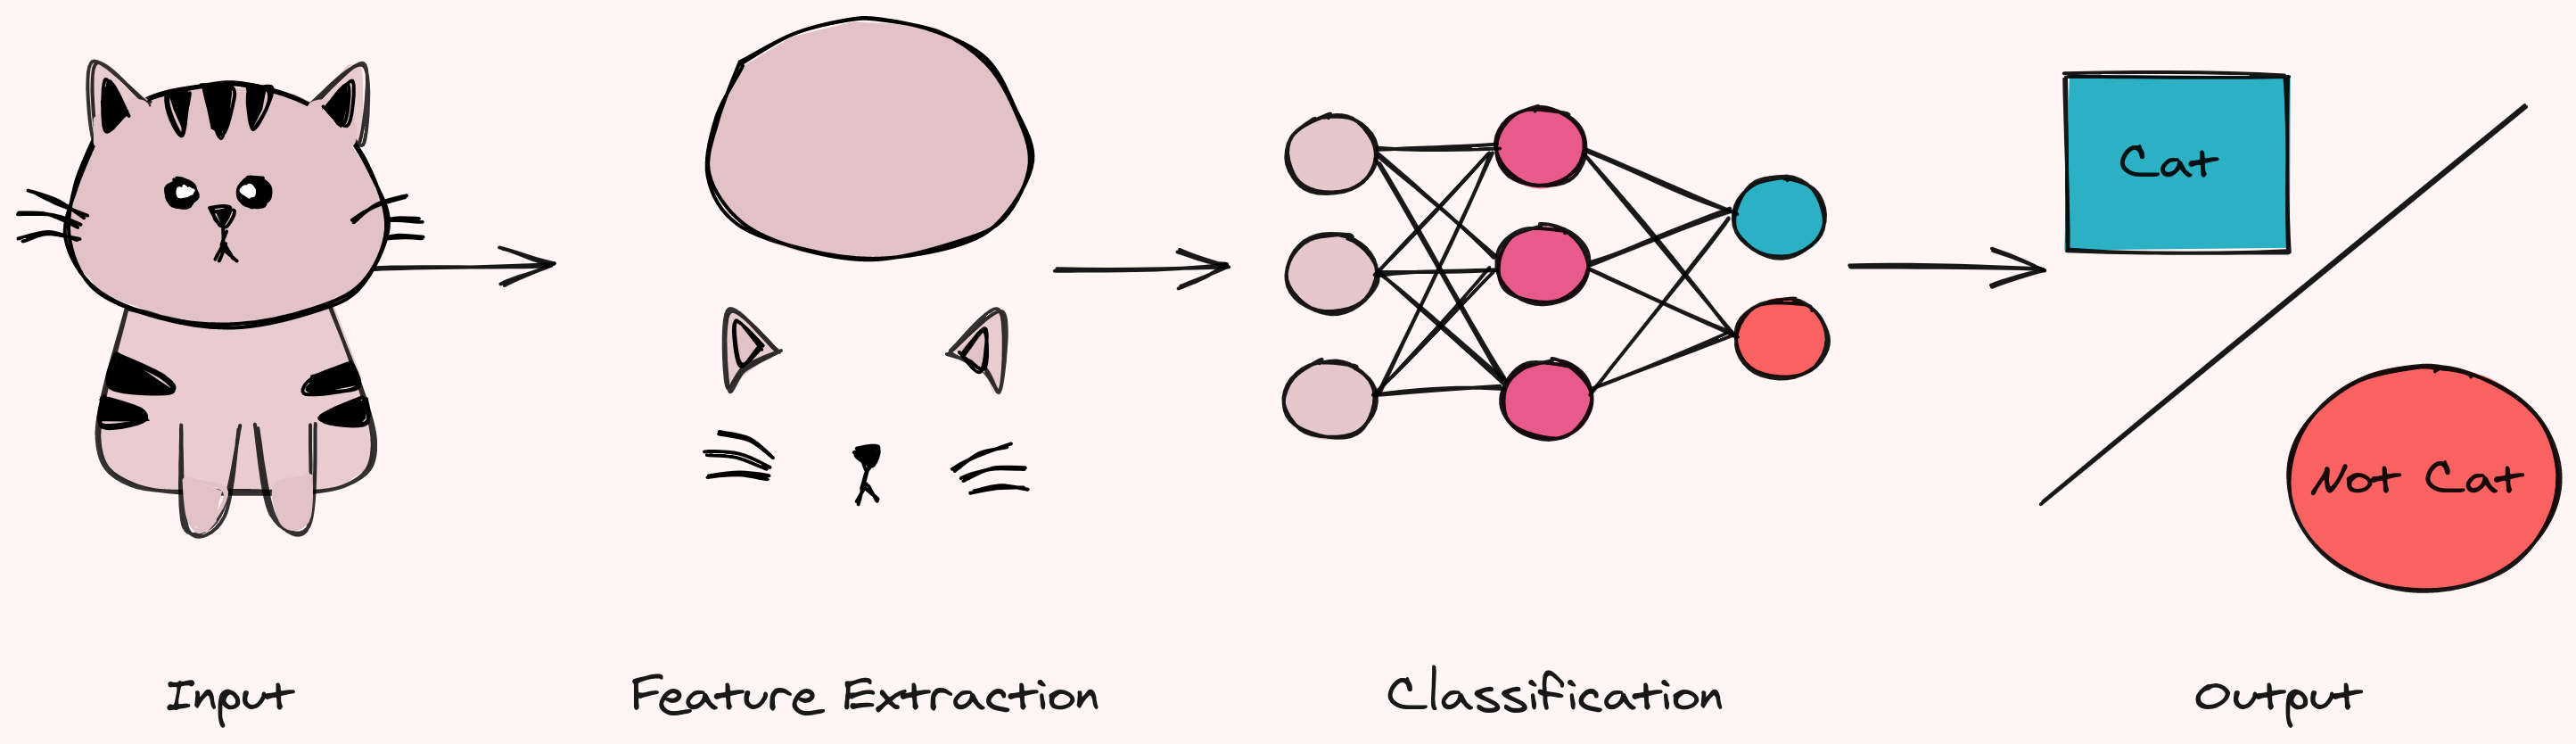
Image by Author
Drawing is also a good way to outline what you want to do before tackling a project.
There are many tools to draw diagrams, but the one I like the most is Excalidraw. In this article, I will show you what Excalidraw is and why it is one of the best tools to draw diagrams.
What is Excalidraw?
Excalidraw is a virtual whiteboard for sketching hand-drawn like diagrams. Here are some nice features of this virtual whiteboard:
Excalidraw allows you to seamlessly create a nice hand-drawn diagram like below on the web.