In this blog we are going to learn about the Docker Compose while orchestrating more than one containers of different monitoring and logging tools.
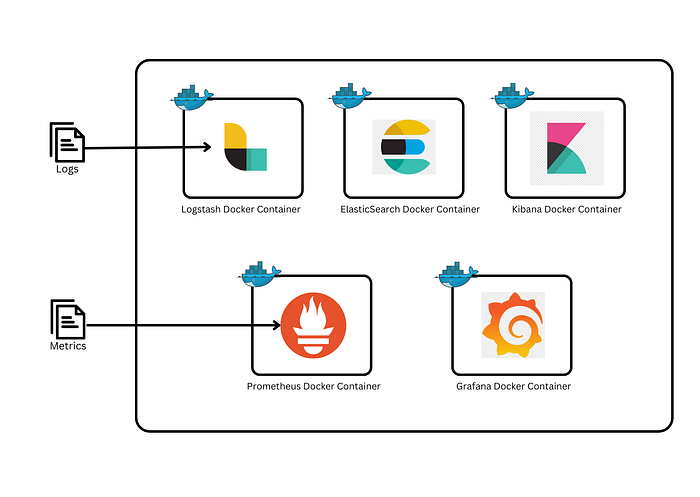
Here the monitoring and logging tools we are using are Elastic Search, Logstash, Kibana , Prometheus and Grafana for which we will create a docker container.
Architecture of the project
Summary of the tools we are using.
- ELASTIC SEARCH
Elasticsearch is a distributed search and analytics engine built on Apache Lucene. It provide us the solutions for Searching, Observerbility and Security purpose.It provides a distributed, multitenant-capable full-text search engine with an HTTP web interface and schema-free JSON documents. The “E” in ELK stack stands for Elastic Search. It basically store the data.